Why is it so hard to buy a home? Prices have far outpaced middle-class incomes. Mortgage rates are above 7% for the first time since 2002. And 3 out of 10 homes are sold above listing price.
But none of those factors fully captures the variety of challenges buyers nationwide face in the current market. The conditions on the ground can vary widely across state and even county lines.
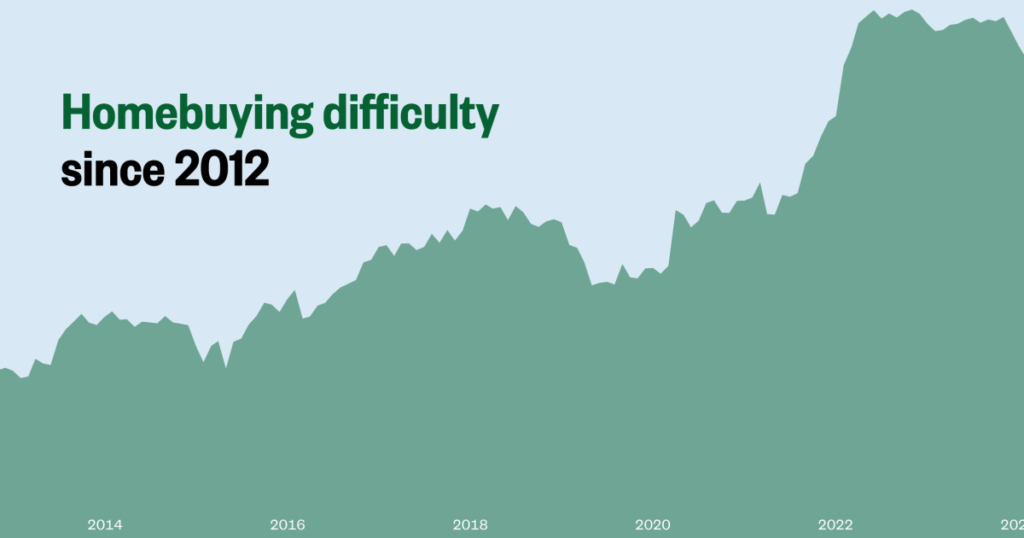
To better capture how housing market conditions shift at the local level — as comprehensively and in as close to real time as possible — we’re introducing a new monthly gauge: the NBC News Home Buyer Index.
The Home Buyer Index, which NBC News developed with the guidance of a real estate industry analyst, a bank economist from the Federal Reserve Bank of Atlanta and other experts, is a number on a scale of 0 to 100 representing the difficulty a potential buyer faces trying to buy a home. The higher the index value, the higher the difficulty.
A low index value, of 10 for example, suggests better purchasing conditions for a buyer — low interest rates, ample homes for sale. Chambers County, Texas, near Houston, is one of the 50 least difficult places to buy in in the country, with low scores on scarcity, cost and competition.
A high value closer to 90 suggests extremely tough conditions, which can result from intense bidding, high insurance costs or steep jumps in home prices relative to income. Prices are soaring in Coconino County, Arizona, making it one of the 25 most difficult counties to buy a home in. Five years ago it was ranked 300, but the median sale price has increased 81%, nearly twice the national figure.
The index measures difficulty nationwide, as well as on the county level, in the counties where there’s enough homebuying data to make informed assessments.
The national index, presented below, captures the big-picture market and economic conditions that affect homebuying across the U.S.
This index consists of four factors:
- Cost: How much a home costs relative to incomes and inflation — as well as how related expenses, such as insurance costs, are changing.
- Competition: How many people are vying for a home — and how aggressive the demand is. This is measured through observations including the percentage of homes sold above list price and the number that went under contract within two weeks of being listed.
- Scarcity: The number of homes that are on the market — and how many more are expected to enter the market in the coming month.
- Economic instability: Market volatility, unemployment and interest rates — reflecting the broader climate in which home shoppers are weighing their decisions.
For April, the overall Home Buyer Index nationally was 82.4, up slightly from March and about 5 points lower than it was this time one year ago.
Improvements in market competitiveness and the broader economy have eased conditions somewhat within the past year. However, high costs and continued housing shortages have kept overall homebuying difficulty high.
The index updates monthly on the Thursday after the third Saturday of the month. The next update is June 20.